
A governor forecast asks a national question through fifty separate state stories. The offices never vote as a bloc. Their power is exercised one veto, appointment, budget, emergency order, and election administration at a time. Still, the balance matters: it shows how broadly each party can act through state government, and how many states can resist a national current moving the other way.
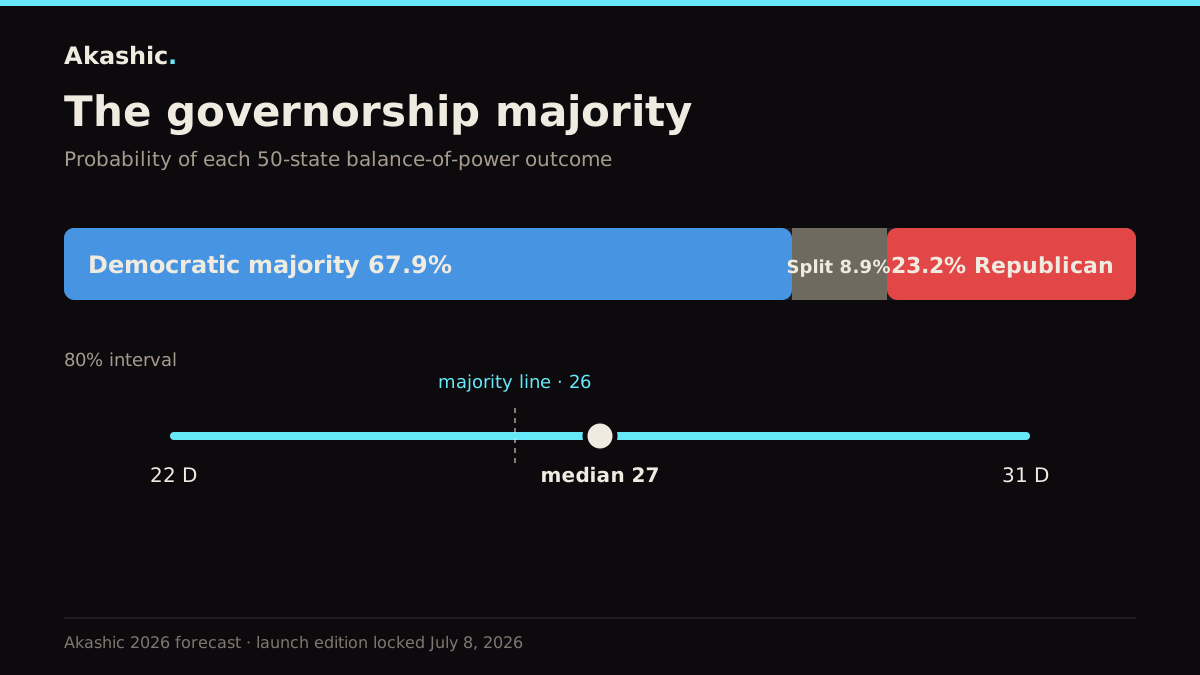
The launch edition covers 36 contests—the regular 2026 gubernatorial class, plus New Hampshire and Vermont, where governors serve two-year terms. It gives Democrats the more likely path to a majority of governorships, but the distribution is wide enough to make the word “favored” an incomplete description.
| Measure | Launch edition, locked July 8 |
|---|---|
| Governorships up in 2026 | 36 |
| Majority line | 26 |
| Democratic majority probability | 67.9% |
| Republican majority probability | 23.2% |
| 25–25 split probability | 8.9% |
| Median Democratic governorships | 27 |
| 80% interval | 22–31 Democratic governorships |
| Non-safe races | 11 |
| Tilt races | 7 |
| Tipping-point race | Florida |
The median is 27 Democratic governorships, one above the majority line. Yet four-fifths of the simulations span from 22 to 31. That interval is the truer portrait of the map: Democrats have more ways to assemble a majority, while Republicans retain a substantial route through a small number of consequential states. The 8.9% chance of a 25–25 split is a third outcome, not a rounding error. A divided national count does not split the powers of any individual office, but it limits how sweeping either party’s claim to state-level reach can be.
A national count made of state stories
Governor races are unusually resistant to a single national explanation. Incumbency can survive a state’s presidential lean. Candidate biography can matter more than it does in a federal race. Scandal, legislative conflict, regional identity, and a state’s habit of divided government all arrive with different weights.
Open seats remove one of the strongest stabilizers. Without an incumbent, the party baseline becomes more visible—but so do the limits of that baseline. The launch map therefore combines two statements that should remain separate: the national environment gives Democrats an advantage, and several of the races that produce that advantage remain highly conditional.
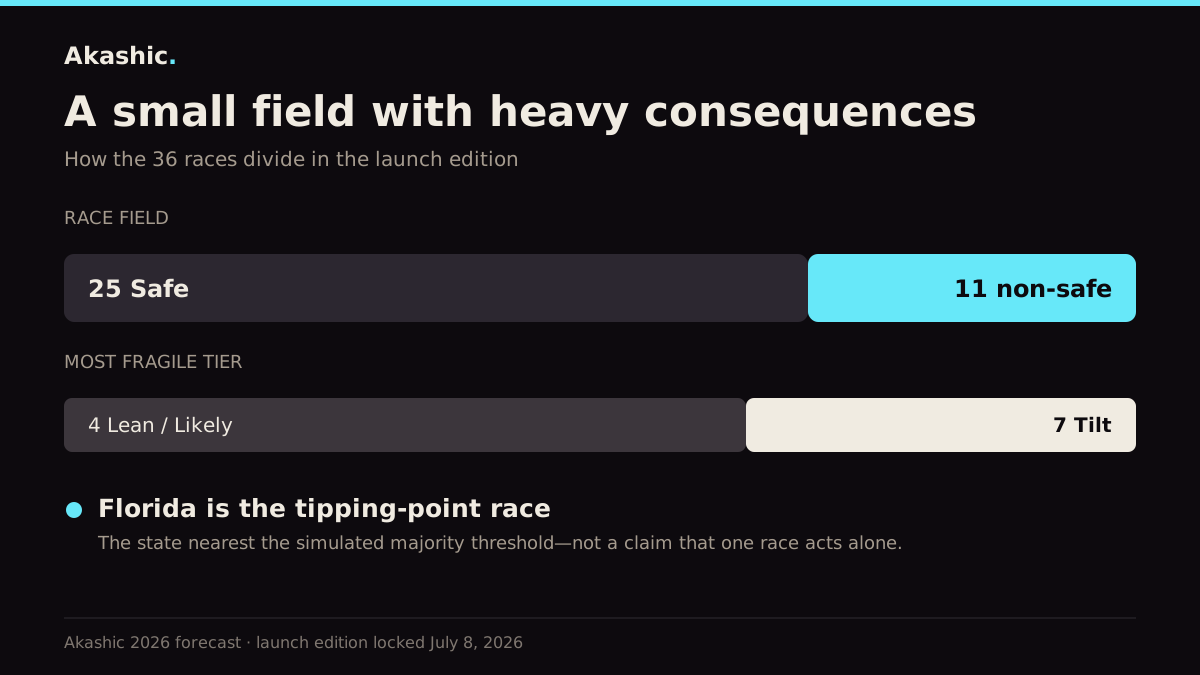
Twenty-five contests sit in the Safe columns. The other eleven carry most of the uncertainty, and seven of those are Tilt. Akashic projects Democratic flips in Alaska, Florida, Georgia, Iowa, Nevada, and Ohio. Kansas is the counter-movement: a Democratic-held open seat rated Tilt Republican.
The asymmetry is important. A Democratic majority in the launch edition is not merely the existing blue map holding in place. It depends in part on gains in difficult states. Nor is the Republican path simply a national wave. It can begin with a successful defense of Republican-held offices and a recovery of a state such as Kansas, then grow if the Democratic reach seats fail together.
Florida, at the threshold
Florida is the tipping-point race in this edition. That label does not mean Florida alone decides the national balance. It means that when the simulated outcomes are ordered from most Democratic to most Republican, Florida sits nearest the point at which the Democratic count reaches 26.
That distinction matters. Tipping points describe the architecture of a forecast, not a prophecy about election night. Florida is useful because it shows the sort of state the Democratic path requires: an open-seat contest where the federal baseline is difficult, but state conditions and the candidates keep the office within reach. If the Democratic map reaches the upper part of its range, Florida is likely to be among the states that moved with it. If Republicans hold the line, Florida is likely to remain on their side of the threshold.
Other races reveal different failure modes. Michigan is a Democratic-held open seat whose importance lies in preventing a favorable map from losing at the foundation. Nevada tests whether a Republican incumbent can withstand a Democratic-leaning environment. Ohio is a more assertive Democratic call in the launch edition, and therefore one of the places where the forecast is most exposed if its reading of candidate and state conditions is too strong.
How to read this map
Start with the interval, not the point estimate. Then look at the eleven non-safe races and ask which ones are moving for the same reason. A broad national shift should appear across several states; a candidate-specific change should remain local. Finally, use the tipping point as a guide to the threshold, not as a substitute for the rest of the field.
The launch edition’s conclusion is limited but clear: Democrats have the stronger path to a majority of governorships. The uncertainty is not incidental to that conclusion. It is produced by the character of governor races themselves—separate offices, open-seat discontinuities, and a competitive set small enough that a few state stories can redraw the national balance.