
Explore every American place.
A page for every place in America — with the full presidential record, demographics, and maps behind each one. Start with the place you know, or read the country at a glance.
- 22,204
- place pages
- 3,143
- counties
- 34
- elections
- 1892–2024
- years of results
Presidential returns 1892–2024 · U.S. Census / ACS demographics · MIT Election Lab & Voteview
Every state, shaded by its 2024 presidential margin — open one for its full profile, or drop straight to its counties, metros, districts, legislature, or media markets. Prefer to browse by geography type? Switch to By level.
Northeast
9 statesNew England, the Mid-Atlantic, and the industrial corridor.South
16 statesFrom the Border South through the Deep South to Texas and the peninsula.Midwest
12 statesThe Great Lakes, the Corn Belt, and the Northern Plains.West
13 statesThe Mountain West, the desert Southwest, and the Pacific Coast.Beyond browsing: compare two places, draw a Place of your own, or ask the data a question directly.
Themed sets of places rolled up as one — read like a single profile, with an honest aggregate margin and a sortable roster. Or start from the marquee: a dozen plates that carry the story of the map.




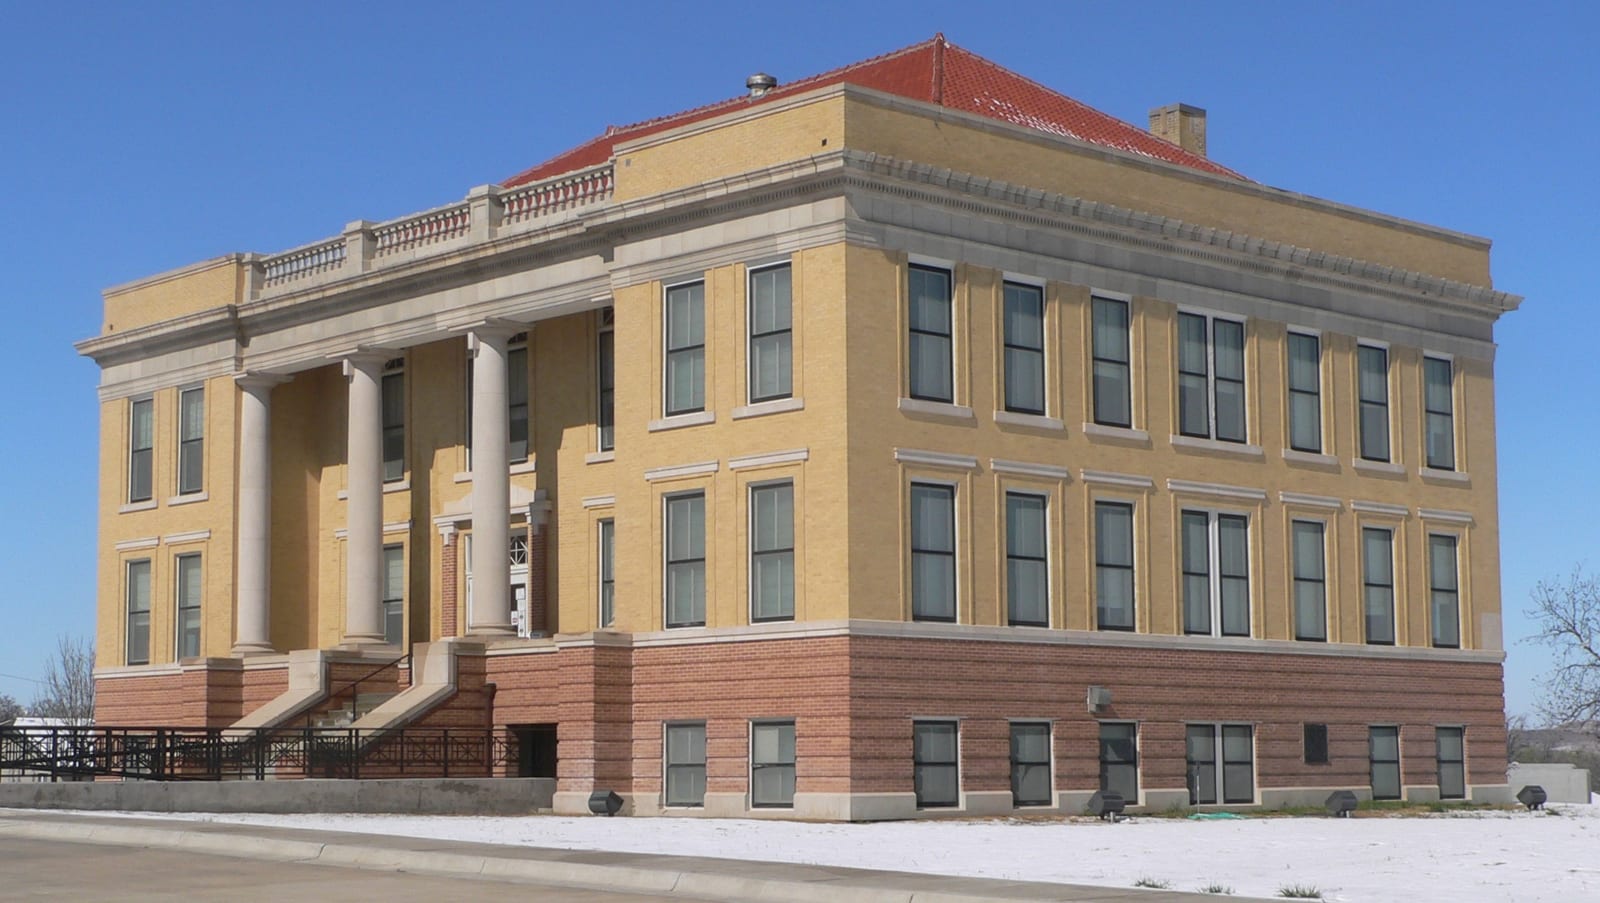

Where Americans are moving between counties — and whether the places they arrive from lean differently than where they land. One input to how the political map shifts, never the whole story.
The migration map behind the vote
The counties gaining and losing the most people to domestic migration (2025), and where in-migration arrives from places that lean differently than the county itself.
Net domestic migration
| Fastest growth | |
|---|---|
| Collin County, TX | +24,102 |
| Montgomery County, TX | +22,690 |
| Pinal County, AZ | +21,315 |
| Polk County, FL | +18,752 |
| Pasco County, FL | +18,078 |
| Marion County, FL | +15,971 |
| Williamson County, TX | +14,764 |
| Horry County, SC | +14,222 |
| Fastest loss | |
| Los Angeles County, CA | −105,471 |
| Miami-Dade County, FL | −72,254 |
| Dallas County, TX | −46,226 |
| Harris County, TX | −43,377 |
| Kings County, NY | −38,847 |
| Queens County, NY | −38,449 |
| Cook County, IL | −31,144 |
| Broward County, FL | −29,517 |
Political churn — where arrivals come from
| Arrivals lean bluer than the county | |
|---|---|
| Richmond County, NY | +65.0 pt |
| Mohave County, AZ | +57.9 pt |
| Parker County, TX | +52.3 pt |
| Forsyth County, GA | +50.7 pt |
| Kootenai County, ID | +48.9 pt |
| Cherokee County, GA | +47.9 pt |
| Lexington County, SC | +47.1 pt |
| Jefferson County, MO | +46.4 pt |
| Arrivals lean redder than the county | |
| Orleans Parish, LA | −70.0 pt |
| St. Louis city, MO | −50.2 pt |
| Pulaski County, AR | −46.6 pt |
| District of Columbia, DC | −46.2 pt |
| Baltimore city, MD | −44.3 pt |
| Richmond city, VA | −44.3 pt |
| Richland County, SC | −43.3 pt |
| Dane County, WI | −42.4 pt |
Churn compares the inflow-weighted presidential lean of the places arrivals came from against the county’s own latest margin. It describes the source places, not how any mover voted — migration is one input to a county’s shifts, not their cause.
The atlas reads by place, by contest, and by person. Every instrument covers the same record from a different angle.
How Akashic is built, what the terms mean, and where it is going.